This document provides a guide to use Clover visibility services, which are initially delivered in the Clover Gambia release. A key assumption of this guide is that Istio 1.0.x has been deployed to Kubernetes (k8s), as it is a foundational element for Clover visibility services.
Clover visibility services are an integrated set of microservices that allow HTTP/gRPC traffic to be observed and analyzed in an Istio service mesh within k8s managed clusters. It leverages observability open source projects from the CNCF community such as Jaeger for distributed tracing and Prometheus for monitoring. These tools are packaged with Istio and service mesh sidecars have extensive hooks built in to interface with them. They gather low-level, per HTTP request driven data. Clover visibility services focus on enriching the data, gathering it from various sources and analyzing it at the system or aggregate level.
The visibility services are comprised of the following microservices all deployed within the clover-system namespace in a k8s cluster:
- clover-controller - exposes REST interface external to the k8s cluster and used to relay messages to other Clover services via gRPC from external agents including cloverctl CLI, web browsers and other APIs, scripts or CI jobs. It incorporates a web application with dashboard views to consume analyzed visibility data and control other Clover services.
- clover-collector - gathers data from tracing (Jaeger) and monitoring (Prometheus) infrastructure that is integrated with Istio using a pull model.
- clover-spark - is a Clover specific Apache Spark service. It leverages Spark 2.3.x native k8s support and includes visibility services artifacts to execute Spark jobs.
- clover-spark-submit - simple service to continually perform Spark job submits interacting with the k8s API to spawn driver and executor pods.
- cassandra - a sink for visibility data from clover-collector with specific schemas for monitoring and tracing.
- redis - holds configuration data and analyzed data for visibility services. Used by clover-controller web application and REST API to maintain state and exchange data.
The table below shows key details of the visibility service manifests outlined above:
| Service | Kubernetes Deployment App Name | Docker Image | Ports |
|---|---|---|---|
| Controller | clover-controller | opnfv/clover-controller | HTTP: 80 (external) gRPC: 50052, 50054 |
| Collector | clover-collector | opnfv/clover-collector | Jaeger: 16686 Prometheus: 9090 gRPC: 50054 Datastore: 6379, 9042 |
| Spark | clover-spark clover-spark-submit | opnfv/clover-spark opnfv/clover-spark-submit | Datastore: 6379, 9042 |
| Data Stores | cassandra redis | cassandra:3 k8s.gcr.io/redis:v1 kubernetes/redis:v1 | 9042 6379 |
The redis and cassandra data stores use community container images while the other services use Clover-specific Dockerhub OPNFV images.
Additionally, visibility services are operated with the cloverctl CLI. Further information on setting up clover-controller and cloverctl can be found at Clover Controller Services Configuration Guide.
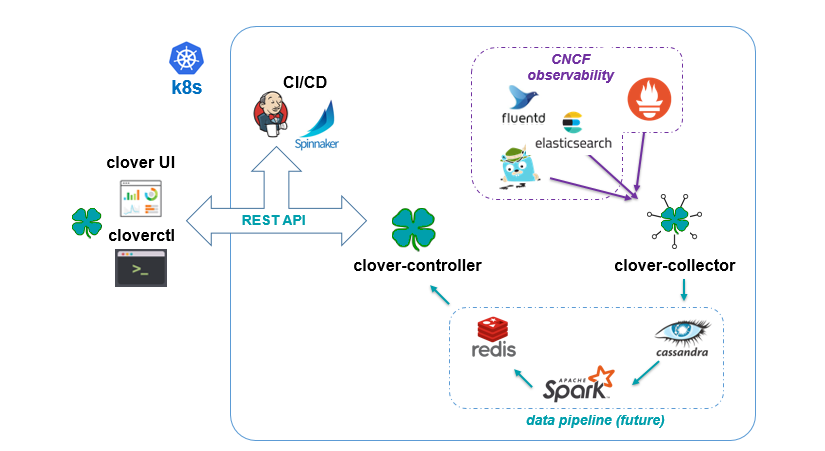
The diagram above shows the flow of data through the visibility services where all blue arrows denote the path of data ingestion originating from the observability tools. The clover-collector reads data from these underlying tools using their REST query interfaces and inserts into schemas within the cassandra data store.
Apache Spark jobs are used to analyze data within cassandra. Spark is deployed using native Kubernetes support added since Spark version 2.3. The clover-spark-submit container continually submits jobs to the Kubernetes API. The API spawns a Spark driver pod which in turn spawns executor pods to run Clover-specific jobs packaged in the clover-spark service.
Analyzed data from clover-spark jobs is written to redis, an in-memory data store. The clover-controller provides a REST API for the analyzed visibility data to be read by other services (cloverctl, CI jobs, etc.) or viewed using a Clover provided visibility web dashboard.
The following assumptions must be met before continuing on to deployment:
- Installation of Docker has already been performed. It’s preferable to install Docker CE.
- Installation of k8s in a single-node or multi-node cluster with at least twelve cores and 16GB of memory. Google Kubernetes Engine (GKE) clusters are supported.
- Installation of Istio in the k8s cluster. See Deploy with Clover container.
- Clover CLI (cloverctl) has been downloaded and setup. Instructions to deploy can be found at Deploying clover-controller.
To deploy the visibility services into your k8s cluster use the cloverctl CLI command shown below:
$ cloverctl create system visibility
Container images with the Gambia release tag will pulled if the tag is unspecified. The release tag is opnfv-7.0.0 for the Gambia release. To deploy the latest containers from master, use the command shown below:
$ cloverctl create system visibility -t latest

Using config file: /home/earrage/.cloverctl.yaml
Creating visibility services
Created clover-system namespace
Created statefulset "cassandra".
Created service "cassandra"
Created pod "redis".
Created service "redis"
Created deployment "clover-collector".
Image: opnfv/clover-collector:latest
Created service "clover-collector"
Created deployment "clover-controller".
Image: opnfv/clover-controller:latest
Created service "clover-controller-internal"
Created serviceaccount "clover-spark".
Created clusterrolebinding "clover-spark-default".
Created clusterrolebinding "clover-spark".
Created deployment "clover-spark-submit".
Image: opnfv/clover-spark-submit:latest
To verify the visibility services deployment, ensure the following pods have been deployed with the command below:
$ kubectl get pod --all-namespaces

NAMESPACE      NAME                                    READY     STATUS
clover-system   clover-collector-7dcc5d849f-6jc6m       1/1       Running
clover-system   clover-controller-74d8596bb5-qrr6b      1/1       Running
clover-system   cassandra-0                             1/1       Running
clover-system   redis                                   2/2       Running
clover-system   clover-spark-submit-6c4d5bcdf8-kc6l9    1/1       Running
Additionally, spark driver and executor pods will continuously be deployed as displayed below:
clover-system   clover-spark-0fa43841362b3f27b35eaf6112965081-driver
clover-system   clover-spark-fast-d5135cdbdd8330f6b46431d9a7eb3c20-driver
clover-system   clover-spark-0fa43841362b3f27b35eaf6112965081-exec-3
clover-system   clover-spark-0fa43841362b3f27b35eaf6112965081-exec-4
In order to setup visibility services, initialization and start commands must be invoked from the cloverctl CLI. There are sample yaml files in yaml directory from the cloverctl binary path. Navigate to this directory to execute the next sequence of commands.
Initialize the visibility schemas in cassandra with the following command:
$ cloverctl init visibility

Using config file: /home/earrage/.cloverctl.yaml
clover-controller address: http://10.145.71.21:32044
Added visibility schemas in cassandra
The initial configuration to the visibility services are the Jaeger tracing and Prometheus connection parameters and sample interval to clover-collector. To start visibility use the sample yaml provided and execute the command:
cloverctl start visibility -f start_visibility.yaml

Started collector on pid: 44
The start_visibility.yaml has defaults for the tracing and monitoring modules packaged with
Istio 1.0.0.
The core requirement for Clover visibility services to function, is for your services to be added to the Istio service mesh. Istio deployment and usage instructions are in the Clover SDC Sample Configuration Guide and the Service Delivery Controller (SDC) sample can be used to evaluate the Clover visibility services initially. A user may inject their own web-based services into the service mesh and track separately.
The clover-controller service comes packaged with a web-based UI with a visibility view.
To access the dashboard, navigate to the clover-controller address for either a NodePort
or LoadBalancer service
See Exposing clover-controller to expose clover-controller externally with a k8s service.
The services visibility will track are based on the deployment/pod names specified in the k8s
resources. Using some sample services from the SDC guide, the proxy-access-control,
clover-server1, clover-server2 and clover-server3 services are specified in the
set_visibility.yaml sample yaml referenced below.
To modify the configuration of the services visibility will track, use the cloverctl CLI, executing the following command:
cloverctl set visibility -f set_visibility.yaml
Use the services: section of the yaml to configure service names to track.
# set_visibility.yaml
services:
    - name: proxy_access_control
    - name: clover_server1
    - name: clover_server2
    - name: clover_server3
metric_prefixes:
    - prefix: envoy_cluster_outbound_9180__
    - prefix: envoy_cluster_inbound_9180__
metric_suffixes:
    - suffix: _default_svc_cluster_local_upstream_rq_2xx
    - suffix: _default_svc_cluster_local_upstream_cx_active
custom_metrics:
    - metric: envoy_tracing_zipkin_spans_sent
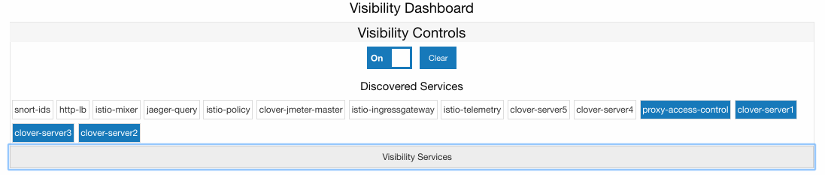
The services being tracked by visibility can also be configured by selecting from the
boxes under Discovered Services within the dashboard, as shown in the graphic below.
Services can be multi-selected by using by holding the Ctrl or command (Mac OS)
keyboard button down while selecting or unselecting. The SDC services that were configured from
the cloverctl CLI above are currently active, denoted as the boxes with blue backgrounds.
In order for any services to be discovered from Jaeger tracing and displayed within the dashboard, some traffic must target the services of interest. Using curl/wget to send HTTP requests to your services will cause services to be discovered. Using Clover JMeter validation services, as detailed JMeter Validation Configuration Guide against SDC sample services will also generate a service listing. The cloverctl CLI commands below will generate traces through the SDC service chain with the JMeter master injected into the service mesh:
$ cloverctl create testplan –f yaml/jmeter_testplan.yaml # yaml located with cloverctl binary
$ cloverctl start testplan
To clear visibility data in cassandra and redis, which truncates cassandra tables and deletes or zeros out redis keys, use the following command:
$ cloverctl clear visibility
This can be useful when analyzing or observing an issue during a particular time horizon.
The same function can be performed from the dashboard UI using the Clear button under
Visibility Controls, as illustrated in the graphic from the previous section.
The visibility dashboard can be used to view visibility data in real-time. The page will
automatically refresh every 5 seconds. To disable continuous page refresh and freeze on a
snapshot of the data, use the slider at the top of the page that defaults to On. Toggling
it will result in it displaying Off.
The visibility dashboard displays various metrics and graphs of analyzed data described in subsequent sections.
System metrics provide aggregate counts of cassandra tables including total traces, spans and metrics, as depicted on the left side of the graphic below.
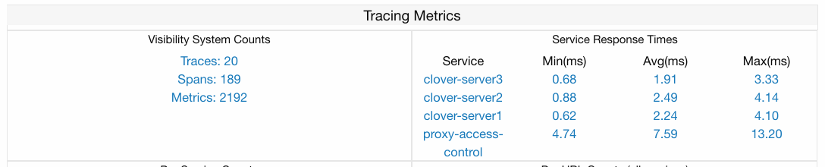
The metrics counter will continually increase, as it is based on time series data from Prometheus. The trace count will correspond to the number of HTTP requests sent to services within the Istio service mesh. The span count ties to trace count, as it is a child object under Jaeger tracing data hierarchy and is based on the service graph (number of interactions between microservices for a given request). It will increase more rapidly when service graph depths are larger.
Per service response times are displayed on the right side of the graphic above and are calculated from tracing data when visibility is started. The minimum, maximum and average response times are output over the entire analysis period.
This category groups schema fields in various combinations to gain insight into the composition of HTTP data and can be used by CI scripts to perform various validations. Metrics include:
- Per service
- Distinct URL
- Distinct URL / HTTP status code
- Distinct user-agent (HTTP header)
- Per service / distinct URL
The dashboard displays bar/pie charts with counts and percentages, as depicted below. Each distinct key is displayed when hovering your mouse over a chart value.
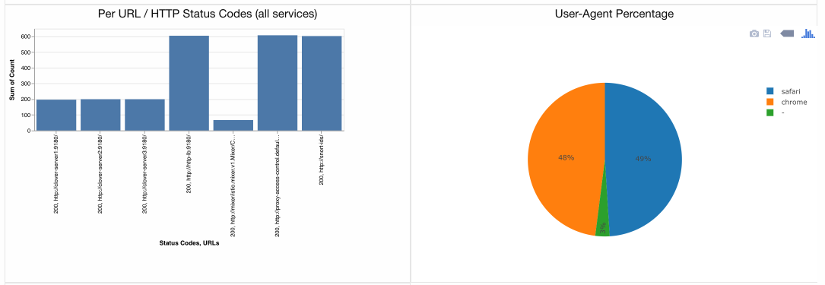
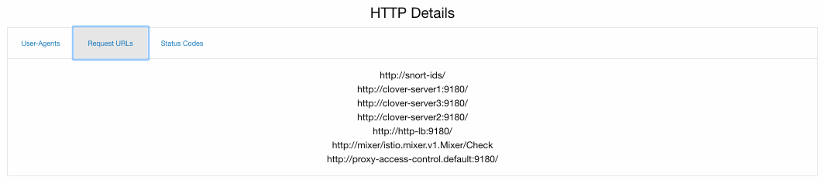
A listing of distinct HTTP user-agents, request URLs and status codes is shown below divided with tabs.
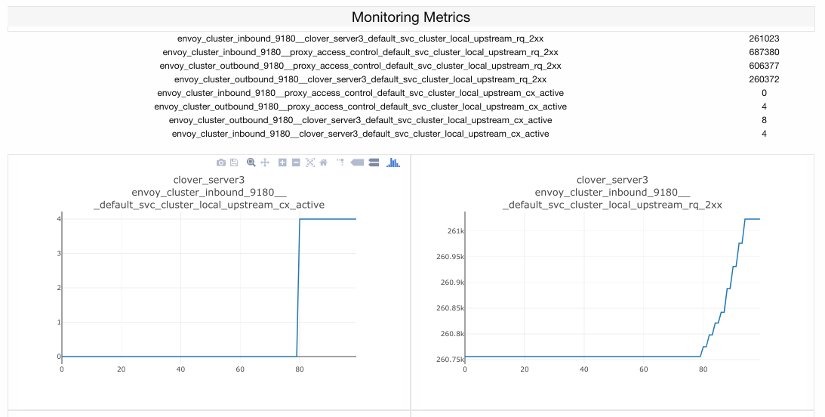
The Istio sidecars (Envoy) provide a lengthy set of metrics exposed through Prometheus. These
metrics can be analyzed with the visibility service by setting up metrics, as outlined in section
Set runtime parameters using Clover CLI. Use metric_prefixes and metric_suffixes
sections of the set visibility yaml for many Envoy metrics that have a key with the service
straddled by a prefix/suffix. A row in the table and a graph will be displayed for each
combination of service, prefix and suffix.
The metrics are displayed in tabular and scatter plots over time formats from the dashboard, as shown in the graphic below:
When you’re finished working with Clover visibility services, you can uninstall them with the following command:
$ cloverctl delete system visibility
The command above will remove the SDC sample services, Istio components and Jaeger/Prometheus tools from your Kubernetes environment.
The OPNFV docker images can be removed with the following commands:
$ docker rmi opnfv/clover-collector
$ docker rmi opnfv/clover-spark
$ docker rmi opnfv/clover-spark-submit
$ docker rmi opnfv/clover-controller
$ docker rmi k8s.gcr.io/redis
$ docker rmi kubernetes/redis
$ docker rmi cassandra:3