This document provides a guide to use the Service Delivery Controller (SDC) sample, which is initially delivered in the Clover Fraser release.
The SDC is a sample set of web-oriented network services that allow the flow of ingress HTTP traffic to be controlled and inspected in an Istio service mesh within Kubernetes. It provides the ability to demonstrate the Istio sandbox including service mesh concepts and surrounding tools including tracing, monitoring, and logging.
The SDC sample comprises the following services:
- Proxy - used to mirror traffic to security (snort-ids) services and propagate traffic to load balancing services. In future releases, the proxy will process security alerts and provide access control by blacklisting clients based on source IP address.
- Load Balancer - provides basic round-robin load balancing to other downstream services without Istio provisions. Istio features built-in load balancing to provide request routing for canary and A/B scenarios. The SDC sample employs both tiers of load balancing to demonstrate how load balancing algorithms can be controlled to address both network and application requirements.
- Intrusion Detection System - used to detect web security vulnerabilities using limited set of rules/signatures and send security alerts to the proxy.
- Server - simple web servers used to terminate web requests from the load balancing services to enable end-to-end traffic flow.
The table below shows key details of the sample Kubernetes manifest for the services outlined above:
| Service | Kubernetes Deployment App Name | Docker Image | Ports |
|---|---|---|---|
| Proxy | proxy-access-control | clover-ns-nginx-proxy | HTTP: 9180 GRPC: 50054 |
| Load Balancers | app: http-lb version: http-lb-v1 version: http-lb-v2 | clover-ns-nginx-lb | HTTP: 9180 GRPC: 50054 |
| Intrusion Detection System (IDS) | snort-ids | clover-ns-snort-ids | HTTP: 80, Redis: 6379 GRPC: 50052 (config) GRPC: 50054 (alerts) |
| Servers | clover-server1 clover-server2 clover-server3 clover-server4 clover-server5 | clover-ns-nginx-server | HTTP: 9180 GRPC: 50054 |
Additionally, the sample uses other ancillary elements including:
- A Redis in-memory data store for the snort IDS service to write alerts. It can also be used by the Clover tracing module to analyze traces over time. Standard community containers of Redis are employed by Clover.
- A Kubernetes Ingress resource (proxy-gateway) to manage external access to the service mesh.
- Clover docker container that is used to invoke deployment and cleanup scripts for the sample. It can also be used to execute scripts that modify run-time service configurations. Using the container avoids the need to clone the source code.
- Optional deployment of Jaeger tracing and Prometheus monitoring tools with access to their browser-based UIs.
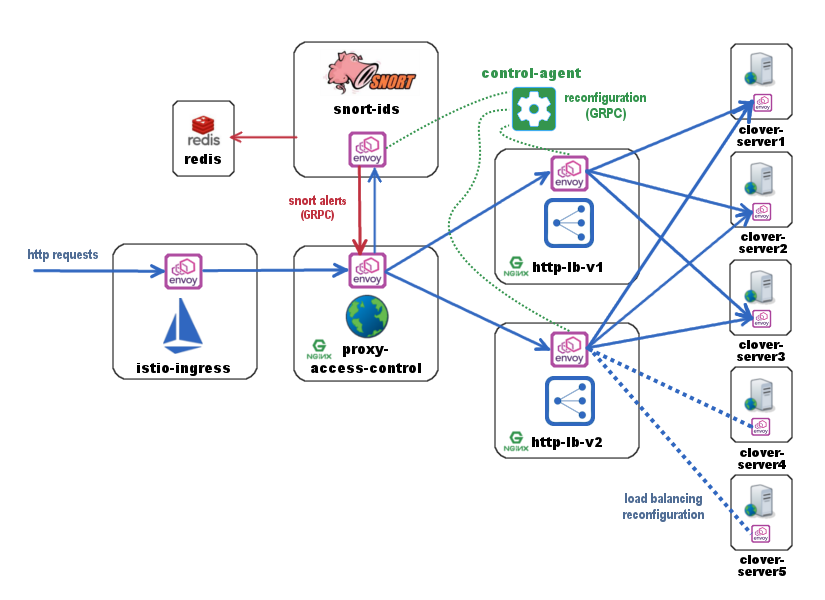
The diagram above shows the flow of web traffic where all blue arrows denote the path of incoming HTTP requests through the service mesh. Requests are directed to the istio-ingress entry point using the Ingress resource (proxy-gateway). Istio-ingress acts as a gateway and sends traffic to the proxy-access-control service. Proxy-access-control mirrors traffic to the snort-ids service for it to monitor all incoming HTTP requests. The snort-ids asynchronously sends alert notifications to proxy-access-control over GRPC on port 50054, which is denoted in red, and stores the details of the alert events into Redis for other services to potentially inspect.
Proxy-access-control also sends traffic to the http-lb load balancing service. Http-lb deploys two versions (http-lb-v1, http-lb-v2) of itself by sharing the same app name (http-lb) but using a distinct version in the Kubernetes manifest. By default, without any further configuration, Istio will load balance requests with a 50/50 percentage split among these two http-lb versions. Both the load balancers are internally configured by default to send traffic to clover-server1/2/3 in round-robin fashion.
A controlling agent that can reside inside or outside of the mesh can be used to modify the run-time configuration of the services, which is denoted in green. Python sample scripts that implement a GRPC client act as a control-agent and are used to reconfigure http-lb-v2 to load balance across clover-server4/5 instead of servers 1/2/3. The sample provides additional examples of modifying run-time configurations such as adding user-defined rules to the snort-ids service to trigger alerts on other network events.
The following assumptions must be met before continuing on to deployment:
- Ubuntu 16.04 was used heavily for development and is advised for greenfield deployments.
- Installation of Docker has already been performed. It’s preferable to install Docker CE.
- Installation of Kubernetes has already been performed. The installation in this guide was executed in a single-node Kubernetes cluster.
- Installation of a pod network that supports the Container Network Interface (CNI). It is recommended to use flannel, as most development work employed this network add-on. Success using Weave Net as the CNI plugin has also been reported.
- Installation of Istio and Istio client (istioctl) is in your PATH (for deploy from source)
The easiest way to deploy the sample into your Kubernetes cluster is to use the Clover container by pulling the container and executing a top-level deploy script using the following two commands:
$ docker pull opnfv/clover:<release_tag>
The <release_tag> is opnfv-7.0.0 for the Gambia release. However, the latest will be pulled if the tag is unspecified. To deploy the Gambia release use these commands:
$ docker pull opnfv/clover:opnfv-7.0.0
$ sudo docker run --rm \
-v ~/.kube/config:/root/.kube/config \
opnfv/clover \
/bin/bash -c '/home/opnfv/repos/clover/samples/scenarios/deploy.sh'
The deploy script invoked above begins by installing Istio 1.0.0 into your Kubernetes environment. It proceeds to deploy the entire SDC manifest. If you’ve chosen to employ this method of deployment, you may skip the next section.
Ensure Istio 1.0.0 is installed, as a prerequisite, using the following commands:
$ curl -L https://github.com/istio/istio/releases/download/1.0.0/istio-1.0.0-linux.tar.gz | tar xz
$ cd istio-1.0.0
$ export PATH=$PWD/bin:$PATH
$ kubectl apply -f install/kubernetes/istio-demo.yaml
The above sequence of commands installs Istio with manual sidecar injection without mutual TLS authentication between sidecars.
To continue to deploy from the source code, clone the Clover git repository and navigate within the samples directory as shown below:
$ git clone https://gerrit.opnfv.org/gerrit/clover
$ cd clover/samples/scenarios
$ git checkout stable/gambia
To deploy the sample in the default Kubernetes namespace, use the following command for Istio manual sidecar injection:
$ istioctl kube-inject -f service_delivery_controller_opnfv.yaml | kubectl apply -f -
To deploy in another namespace, use the ‘-n’ option. An example namespace of ‘sdc’ is shown below:
$ kubectl create namespace sdc
$ istioctl kube-inject -f service_delivery_controller_opnfv.yaml | kubectl apply -n sdc -f -
When using the above SDC manifest, all required docker images will automatically be pulled
from the OPNFV public Dockerhub registry. An example of using a Docker local registry is also
provided in the /clover/samples/scenario directory.
To verify the entire SDC sample is deployed, ensure the following pods have been deployed with the command below:
$ kubectl get pod --all-namespaces
The listing below must include the following SDC pods assuming deployment in the default Kubernetes namespace:
$ NAMESPACE      NAME                                    READY     STATUS
default        clover-server1-68c4755d9c-7s5q8           2/2       Running
default        clover-server2-57d8b786-rf5x7             2/2       Running
default        clover-server3-556d5f79cf-hk6rv           2/2       Running
default        clover-server4-6d9469b884-8srbk           2/2       Running
default        clover-server5-5d64f74bf-l7wqc            2/2       Running
default        http-lb-v1-59946c5744-w658d               2/2       Running
default        http-lb-v2-5df78b6849-splp9               2/2       Running
default        proxy-access-control-6b564b95d9-jg5wm     2/2       Running
default        redis                                     2/2       Running
default        snort-ids-5cc97fc6f-zhh5l                 2/2       Running
The result of the Istio deployment must include the following pods:
$ NAMESPACE    NAME                                             READY     STATUS
istio-system   grafana-6995b4fbd7-pjgbh                         1/1       Running
istio-system   istio-citadel-54f4678f86-t2dng                   1/1       Running
istio-system   istio-egressgateway-5d7f8fcc7b-hs7t4             1/1       Running
istio-system   istio-galley-7bd8b5f88f-wtrdv                    1/1       Running
istio-system   istio-ingressgateway-6f58fdc8d7-vqwzj            1/1       Running
istio-system   istio-pilot-d99689994-b48nz                      2/2       Running
istio-system   istio-policy-766bf4bd6d-l89vx                    2/2       Running
istio-system   istio-sidecar-injector-85ccf84984-xpmxp          1/1       Running
istio-system   istio-statsd-prom-bridge-55965ff9c8-q25rk        1/1       Running
istio-system   istio-telemetry-55b6b5bbc7-qrg28                 2/2       Running
istio-system   istio-tracing-77f9f94b98-zljrt                   1/1       Running
istio-system   prometheus-7456f56c96-zjd29                      1/1       Running
istio-system   servicegraph-684c85ffb9-9h6p7                    1/1       Running
To determine how incoming http traffic on port 80 will be translated, use the following command:
$ kubectl get svc -n istio-system | grep LoadBalancer
NAME                   TYPE           CLUSTER-IP       EXTERNAL-IP   PORT(S)
istio-ingressgateway   LoadBalancer   10.111.40.165    <pending>     80:32410/TCP,443:31390/TCP
Note, the CLUSTER-IP of the service will be unused in this example since load balancing service types are unsupported in this configuration. It is normal for the EXTERNAL-IP to show status <pending> indefinitely
In this example, traffic arriving on port 32410 will flow to istio-ingressgateway. The
istio-ingressgateway service will route traffic to the proxy-access-control service based on
configured Istio Gateway and VirtualService resources, which are shown below. The
Gateway defines a gateway for external traffic to enter the Istio service mesh based on
incoming protocol, port and domain (hosts: section currently using wildcard). The
VirtualService associates to a particular Gateway (sdc-gateway here) and allows for route
rules to be setup. In the example below, any URL with prefix ‘/’ will be routed to the service
proxy-access-control on port 9180. Additionally, ingress traffic can be mirrored by
adding a directive to the VirtualService definition. Below, all matching traffic will be
mirrored to the snort-ids (duplicating internal mirroring performed by the
proxy-access-control for illustrative purposes)
This allows the traffic management and policy features of Istio available to external services and clients.
apiVersion: networking.istio.io/v1alpha3
kind: Gateway
metadata:
  name: sdc-gateway
spec:
  selector:
    istio: ingressgateway # use istio default controller
  servers:
  - port:
      number: 80
      name: http
      protocol: HTTP
    hosts:
    - "*"
---
apiVersion: networking.istio.io/v1alpha3
kind: VirtualService
metadata:
  name: sdcsample
spec:
  hosts:
  - "*"
  gateways:
  - sdc-gateway
  http:
  - match:
    - uri:
        prefix: /
    route:
    - destination:
        host: proxy-access-control
        port:
          number: 9180
    mirror:
      host: snort-ids
To confirm the scenario is running properly, HTTP GET requests can be made from an external host with a destination of the Kubernetes cluster. Requests can be invoked from the host OS of the Kubernetes cluster. Modify the port used below (32410) with the port obtained from section Determining the ingress IP and port. If flannel is being used, requests can use the default flannel CNI IP address, as shown below:
$ wget http://10.244.0.1:32410/
$ curl http://10.244.0.1:32410/
An IP address of a node within the Kubernetes cluster may also be employed.
An HTTP response will be returned as a result of the wget or curl command, if the SDC sample is operating correctly. However, the visibility into what services were accessed within the service mesh remains hidden. The next section Exposing tracing and monitoring shows how to inspect the internals of the Istio service mesh.
The Jaeger tracing UI is exposed outside of the Kubernetes cluster via any node IP in the cluster using the following commands (above command already executes the two commands below):
$ kubectl expose -n istio-system deployment istio-tracing --port=16686 --type=NodePort
Likewise, the Prometheus monitoring UI is exposed with the following command:
$ kubectl expose -n istio-system deployment prometheus --port=9090 --type=NodePort
To find the ports the Jaeger tracing and Prometheus monitoring UIs are exposed on, use the following command:
$ kubectl get svc -n istio-system | grep NodePort
NAMESPACE      NAME              TYPE      CLUSTER-IP   EXTERNAL-IP   PORT(S)
istio-system   istio-tracing     NodePort  10.105.94.85 <none>        16686:32174/TCP
istio-system   prometheus        NodePort  10.97.74.230 <none>        9090:32708/TCP
In the example above, the Jaeger tracing web-based UI will be available on port 32174 and the Prometheus monitoring UI on port 32708. In your browser, navigate to the following URLs for Jaeger and Prometheus respectively:
http://<node IP>:32174
http://<node IP>:32708
Where node IP is an IP of one of the Kubernetes cluster node(s) on a CNI IP address. Alternatively, the tracing and monitoring services can be exposed with a LoadBalancer service if supported by your Kubernetes cluster (such as GKE), as shown below for tracing:
kind: Service
apiVersion: v1
metadata:
  name: istio-tracing
spec:
  selector:
    app: jaeger
  ports:
  - name: http
    protocol: TCP
    port: 80
    targetPort: 16686
  type: LoadBalancer
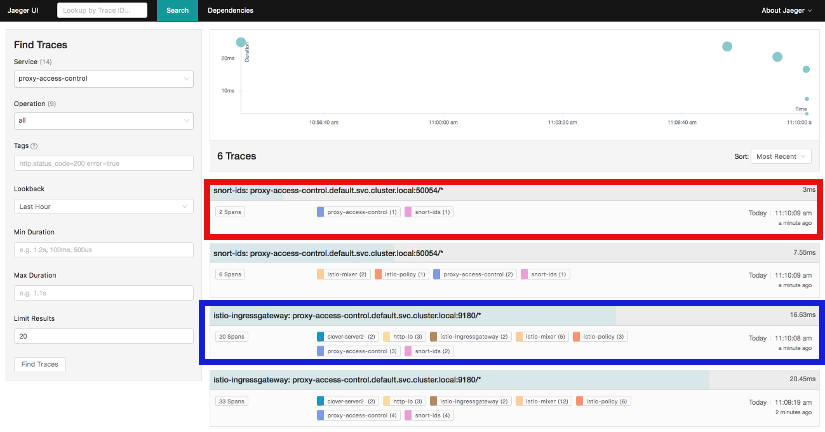
The diagram above shows the Jaeger tracing UI after traces have been fetched for the
proxy-access-control service. After executing an HTTP request using the simple curl/wget
commands outlined in Using the sample , a list of SDC services will be displayed
in the top left drop-down box labelled Service. Choose proxy-access-control in
the drop-down and click the Find Traces button at the bottom of the left controls.
The blue box denotes what should be displayed for the services that were involved in
handling the request including:
- istio-ingressgateway
- proxy-access-control
- snort-ids
- http-lb
- clover-server1 OR clover-server2 OR clover-server3
The individual traces can be clicked on to see the details of the messages between services.
The following control-plane actions can be invoked via GRPC messaging from a controlling agent. For this example, it is conducted from the host OS of a Kubernetes cluster node using Clover system services. This requires clover-controller and cloverctl CLI be deployed. See instructions at Deploying clover-controller.
By default, both versions of the load balancers send incoming HTTP requests to clover-server1/2/3 in round-robin fashion. To have the version 2 load balancer (http-lb-v2) send its traffic to clover-server4/5 instead, issue the following command from the cloverctl CLI:
$ cloverctl set lb -f lbv2.yaml
The lbv2.yaml is available from the yaml directory relative to the cloverctl binary.
If the command executes successfully, the return message should appear as below:
Modified nginx config
If several more HTTP GET requests are subsequently sent to the ingress, the Jaeger UI should begin to display requests flowing to clover-server4/5 from http-lb-v2. The http-lb-v1 version of the load balancer will still balance requests to clover-server1/2/3.
The snort service installs the readily available community rules. An initial, basic provision to allow custom rule additions has been implemented within this release. A custom rule will trigger alerts and can be defined in order to inspect network traffic. This capability, including rule manipulation, will be further expounded upon in subsequent releases. For the time being, the following basic rule additions can be performed using a client sample script.
A snort IDS alert can be triggered by adding the HTTP User-Agent string shown below. The
signature that invokes this alert is part of the community rules that are installed in the
snort service by default. Using the curl or wget commands below, an alert can be observed using
the Jaeger tracing browser UI. It will be displayed as a GRPC message on port 50054 from the
snort-ids service to the proxy-access-control service. The red box depicted in the
Jaeger UI diagram in section Exposing tracing and monitoring shows what should be displayed
for the alerts. Drilling down into the trace will show a GPRC message from snort with HTTP URL
http://proxy-access-control:50054/nginx.Controller/ProcessAlerts.
$ wget -U 'asafaweb.com' http://10.244.0.1:32410/
Or alternatively with curl, issue this command to trigger the alert: : .. code-block:: bash
$ curl -A ‘asafaweb.com’ http://10.244.0.1:32410/
The community rule can be copied to local rules in order to ensure an alert is generated each time the HTTP GET request is observed by snort using the following commands from the cloverctl CLI:
$ cloverctl create idsrules -f idsrule_scan.yaml
$ cloverctl stop ids
$ cloverctl start ids
The idsrule_scan.yaml is available from the yaml directory relative to the cloverctl
binary. Successful completion of the above commands will yield output similar to the following:
Added to local rules
Stopped Snort on pid: 48, Cleared Snort logs
Started Snort on pid: 155
To add an ICMP rule to snort service, use the following command:
$ cloverctl create idsrules -f idsrule_icmp.yaml
$ cloverctl stop ids
$ cloverctl start ids
The idsrule_icmp.yaml is available from the yaml directory relative to the cloverctl
Successful execution of the above commands will trigger alerts whenever ICMP packets are observed
by the snort service. An alert can be generated by pinging the snort service using the flannel IP
address assigned to the snort-ids pod. The Jaeger UI can again be inspected and should display
the same ProcessAlert messages flowing from the snort-ids to the proxy-access-control
service for ICMP packets.
This section assumes alert messages have already been successfully generated from the snort-ids service using the instructions outlined in section Adding rules to snort-ids.
The snort-ids service writes the details of alert events into a Redis data store deployed
within the Kubernetes cluster. This event and packet data can be inspected by first
installing the redis-tools Linux package on one of the nodes within the Kubernetes cluster.
For a Ubuntu host OS, this can be performed with the following command:
$ sudo apt-get install redis-tools
Assuming a flannel CNI plugin, Redis can then be accessed by finding the IP assigned to the Redis pod with the command:
$ kubectl get pod --all-namespaces -o wide
NAMESPACE      NAME        READY     STATUS    RESTARTS   AGE       IP
default        redis       2/2       Running   0          2d        10.244.0.176
In the example listing above, the Redis pod IP is at 10.244.0.176. This IP can be used to access the Redis CLI with the command:
$ redis-cli -h 10.244.0.176
10.244.0.176:6379>
The redis CLI prompt ensues and the alert event indexes can be fetched with the Redis SMEMBERS
set command with the key snort_events for the argument, as shown below:
10.244.0.176:6379> SMEMBERS snort_events
1) "1"
2) "2"
3) "3"
4) "4"
5) "5"
6) "6"
The individual alert details are stored as Redis hashes and can be retrieved with the
Redis HGETALL hash command to get the values of the entire hash with key
snort_event:1 formed by using the prefix of snort_event: concatenated with an index
retrieved from the prior listing output from the SMEMBERS command, as shown below:
10.244.0.176:6379> HGETALL snort_event:1
1)  "blocked"
2)  "0"
3)  "packet-microsecond"
4)  "726997"
5)  "packet-second"
6)  "1524609217"
7)  "pad2"
8)  "None"
9)  "destination-ip"
10) "10.244.0.183"
11) "signature-revision"
12) "1"
13) "signature-id"
14) "10000001"
15) "protocol"
16) "1"
17) "packets"
18) "[]"
19) "source-ip.raw"
20) "\n\xf4\x00\x01"
21) "dport-icode"
22) "0"
23) "extra-data"
24) "[]"
25) "length"
26) "98"
27) "priority"
28) "0"
29) "linktype"
30) "1"
31) "classification-id"
32) "0"
33) "event-id"
34) "1"
35) "destination-ip.raw"
36) "\n\xf4\x00\xb7"
37) "generator-id"
38) "1"
39) "appid"
40) "None"
41) "sport-itype"
42) "8"
43) "event-second"
44) "1524609217"
45) "impact"
46) "0"
47) "data"
48) "\nX\n\xf4\x00\xb7\nX\n\xf4\x00\x01\b\x00E\x00\x00T\x95\x82@\x00@\x01\x8e\x87\n\xf4\x00\x01\n\xf4\x00\xb7\b\x00T\x06{\x02\x00\x01\xc1\xb0\xdfZ\x00\x00\x00\x00\xbe\x17\x0b\x00\x00\x00\x00\x00\x10\x11\x12\x13\x14\x15\x16\x17\x18\x19\x1a\x1b\x1c\x1d\x1e\x1f !\"#$%&'()*+,-./01234567"
49) "mpls-label"
50) "None"
51) "sensor-id"
52) "0"
53) "vlan-id"
54) "None"
55) "event-microsecond"
56) "726997"
57) "source-ip"
58) "10.244.0.1"
59) "impact-flag"
60) "0"
The alert above was generated for an ICMP packet after adding the custom rule for ICMP outlined in
section Adding rules to snort-ids. The ICMP rule/signature ID that was used when adding the
custom rule is 10000001 and is output in the above listing.
To exit the Redis CLI, use the command exit.
When you’re finished working on the SDC sample, you can uninstall it with the following command:
 $ sudo docker run --rm \
-v ~/.kube/config:/root/.kube/config \
opnfv/clover \
/bin/bash -c '/home/opnfv/repos/clover/samples/scenarios/clean.sh'
The command above will remove the SDC sample services, Istio components and Jaeger/Prometheus tools from your Kubernetes environment.
The SDC sample services can be uninstalled from the source code using the commands below:
$ cd clover/samples/scenarios
$ kubectl delete -f service_delivery_controller_opnfv.yaml

pod "redis" deleted
service "redis" deleted
deployment "clover-server1" deleted
service "clover-server1" deleted
deployment "clover-server2" deleted
service "clover-server2" deleted
deployment "clover-server3" deleted
service "clover-server3" deleted
deployment "clover-server4" deleted
service "clover-server4" deleted
deployment "clover-server5" deleted
service "clover-server5" deleted
deployment "http-lb-v1" deleted
deployment "http-lb-v2" deleted
service "http-lb" deleted
deployment "snort-ids" deleted
service "snort-ids" deleted
deployment "proxy-access-control" deleted
service "proxy-access-control" deleted
ingress "proxy-gateway" deleted
Istio components will not be uninstalled with the above command, which deletes using the SDC manifest file. To remove the Istio installation, navigate to the root directory where Istio was installed from source and use the following command:
$ cd istio-1.0.0
$ kubectl delete -f install/kubernetes/istio-demo.yaml
The OPNFV docker images can be removed with the following commands:
$ docker rmi opnfv/clover-ns-nginx-proxy
$ docker rmi opnfv/clover-ns-nginx-lb
$ docker rmi opnfv/clover-ns-nginx-server
$ docker rmi opnfv/clover-ns-snort-ids
$ docker rmi opnfv/clover
If deployment was performed with the Clover container, the first four images above will not be present. The Redis docker images can be removed with the following commands, if deployed from source:
$ docker rmi k8s.gcr.io/redis
$ docker rmi kubernetes/redis
If docker images were built locally, they can be removed with the following commands:
$ docker rmi localhost:5000/clover-ns-nginx-proxy
$ docker rmi clover-ns-nginx-proxy
$ docker rmi localhost:5000/clover-ns-nginx-lb
$ docker rmi clover-ns-nginx-lb
$ docker rmi localhost:5000/clover-ns-nginx-server
$ docker rmi clover-ns-nginx-server
$ docker rmi localhost:5000/clover-ns-snort-ids
$ docker rmi clover-ns-snort-ids